

Placements dashboard
Criteo is connected to 80+ RTB platforms with direct and exclusive partnerships with 3,700+ publishers across all markets. With your Criteo Campaigns, your ads are placed in different domains (publishers) and environments (websites and apps), optimizing placements at a user level to ensure we’re reaching them wherever they are browsing naturally on their various devices across the open internet.
The Placements Dashboard in Analytics in Management Center allows you to analyze the performance for each publisher, comparing displays, clicks and sales generated for each of your placements we’ve had the opportunity to serve your ads on.
How to use this report:
Your Campaigns will need to have been live a minimum of 24 hours before you see data populate in this dashboard.
Data for this report is refreshed once daily between the hours of 8 AM and 12:30 AM UTC.
Please note that the data provided in the Placements Dashboard is limited to three months.
Using the Calendar icon in the top left corner of the screen, start by selecting the date range you want to analyze.


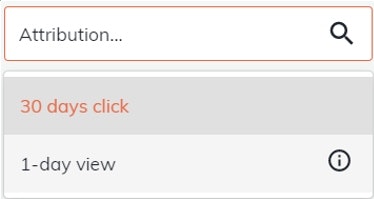
We can also report performance at a placement level with 30 day click or 1-day view attribution using the dropdown menu in the top right corner of the screen.

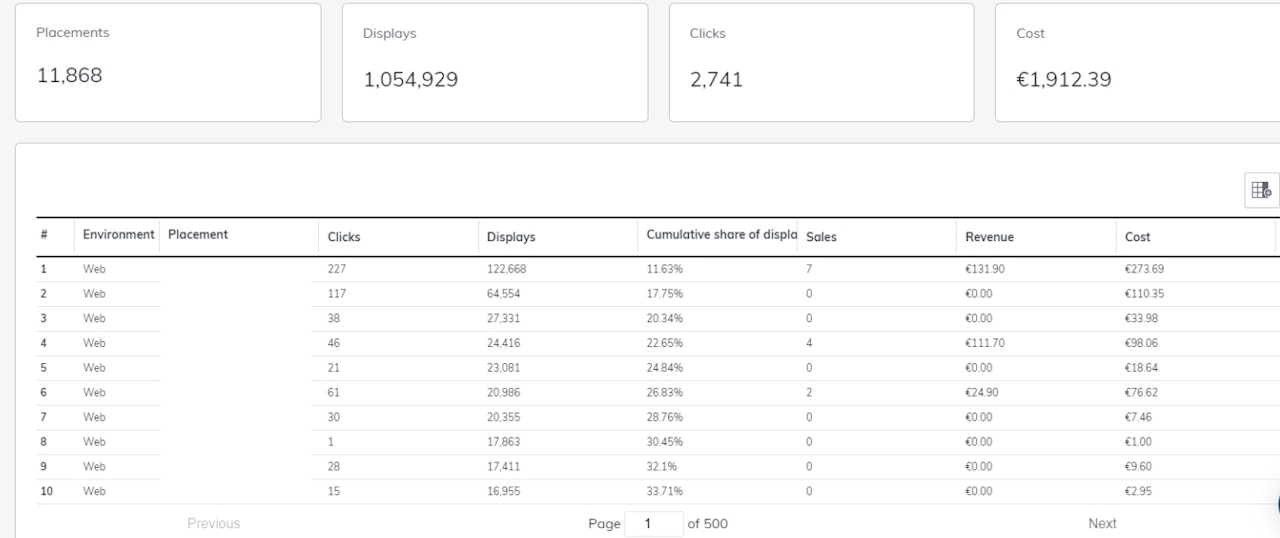
This report will have the metrics Placements, Displays, Clicks and Cost built in to give you a high-level overview of these cumulative metrics during the period analyzed.
Below these metrics, a table will be built out to give you an overview of performance by placement with the metrics on Clicks, Displays, Cumulative Share of Voice (SOV), Sales, Revenue and Cost pre-built into this report.
Clicking into the header of this table on any of the metrics listed will reverse order the chart for the selected metric, ordering Placements from lowest frequency of Display to the highest frequency of Display in the period analyzed, for example. Clicking again will reverse the order again, showing highest frequency to lowest for the selected metric.


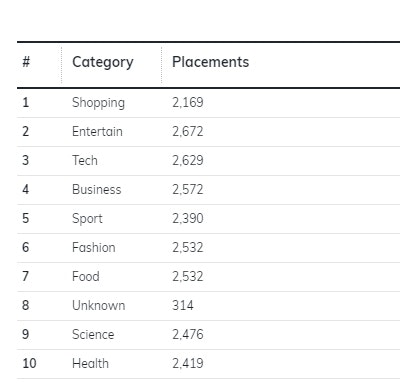
Choosing to Analyze performance by Category rather than Placement will give you many of the same controls listed above, but the contents of the graph will give you a high-level overview of performance per Publisher Category.

