Create a new Custom report
Use the left navigation bar and go to Analytics > Reports library.
Click on the + New custom report button in the top right corner to create a new custom report.
Choose your data display methods
Select up to 3 ways to display your performance data. You can either display a table or choose visualizations and tiles. Each creates a block that you can name, edit, move, or delete according to what insights you wish to display and how.
Display Options:
Table - The table feature allows you to choose from a wide array of dimensions and metrics to break down your data. We've added a time series view to help you visualize how your metrics evolve over time.
Visualizations - This block helps you create powerful graphs to follow how 3 of your metrics are evolving over time in relation to each other. You can create as many visualizations as you want and either display them with a bar chart or in Time series.
Tiles - Tiles help you deep dive into one metric of your choice. You can add as many tiles as you want per Custom report to get a bird's eye view of your performance.

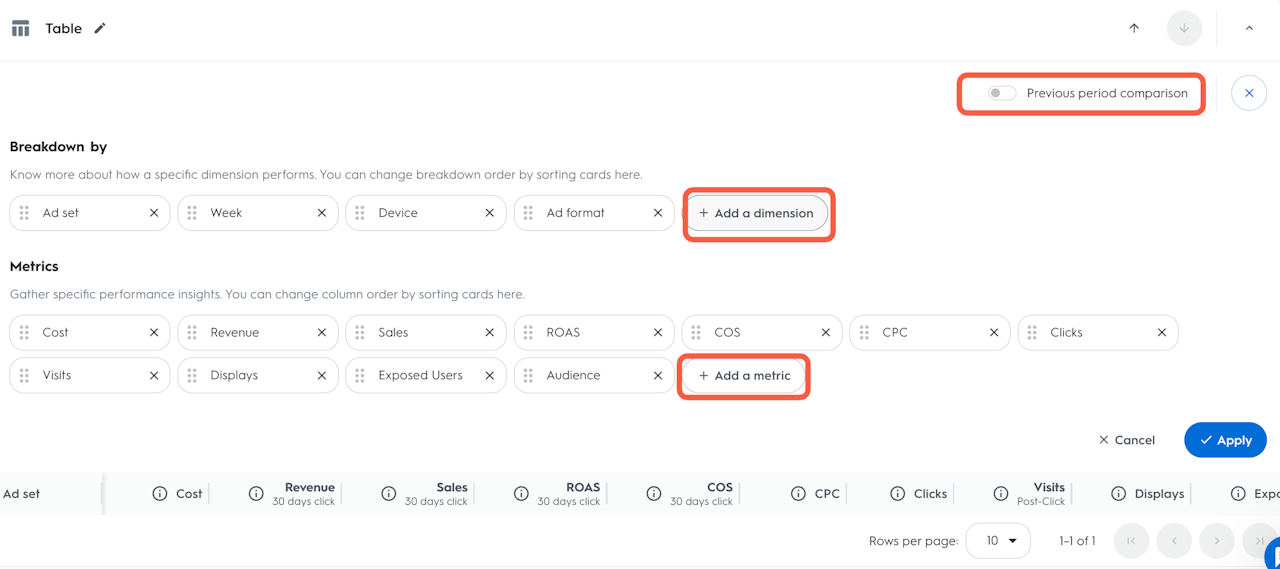
Next, start adding metrics to your report using the Add a metric button.
You can add unlimited metrics to customize the dashboard to your needs.
Available metrics include:
Performance metrics: ROAS, conversion rate, CTR, CPC.
Volume metrics: Displays, clicks, visits, sales.
Efficiency metrics: CPM, CPO, cost per visit.
Advanced metrics: Audience reach, frequency, viewability.
You can add multiple breakdowns to customize the dashboard to your needs.
Select breakdowns relevant to your analysis:
Campaign structure: Advertiser, campaign, ad set.
Audience targeting: Device, OS, demographics.
Time-based: Date, hour, week, month, year.
Other dimensions: Channel, media type, goal.
You can choose to activate the Previous period comparison to analyze how your metrics have developed period-over-period.
The previous period comparison will add the percentage of the change, period-over-period, to your data table. A color code will enhance the readability of your data.
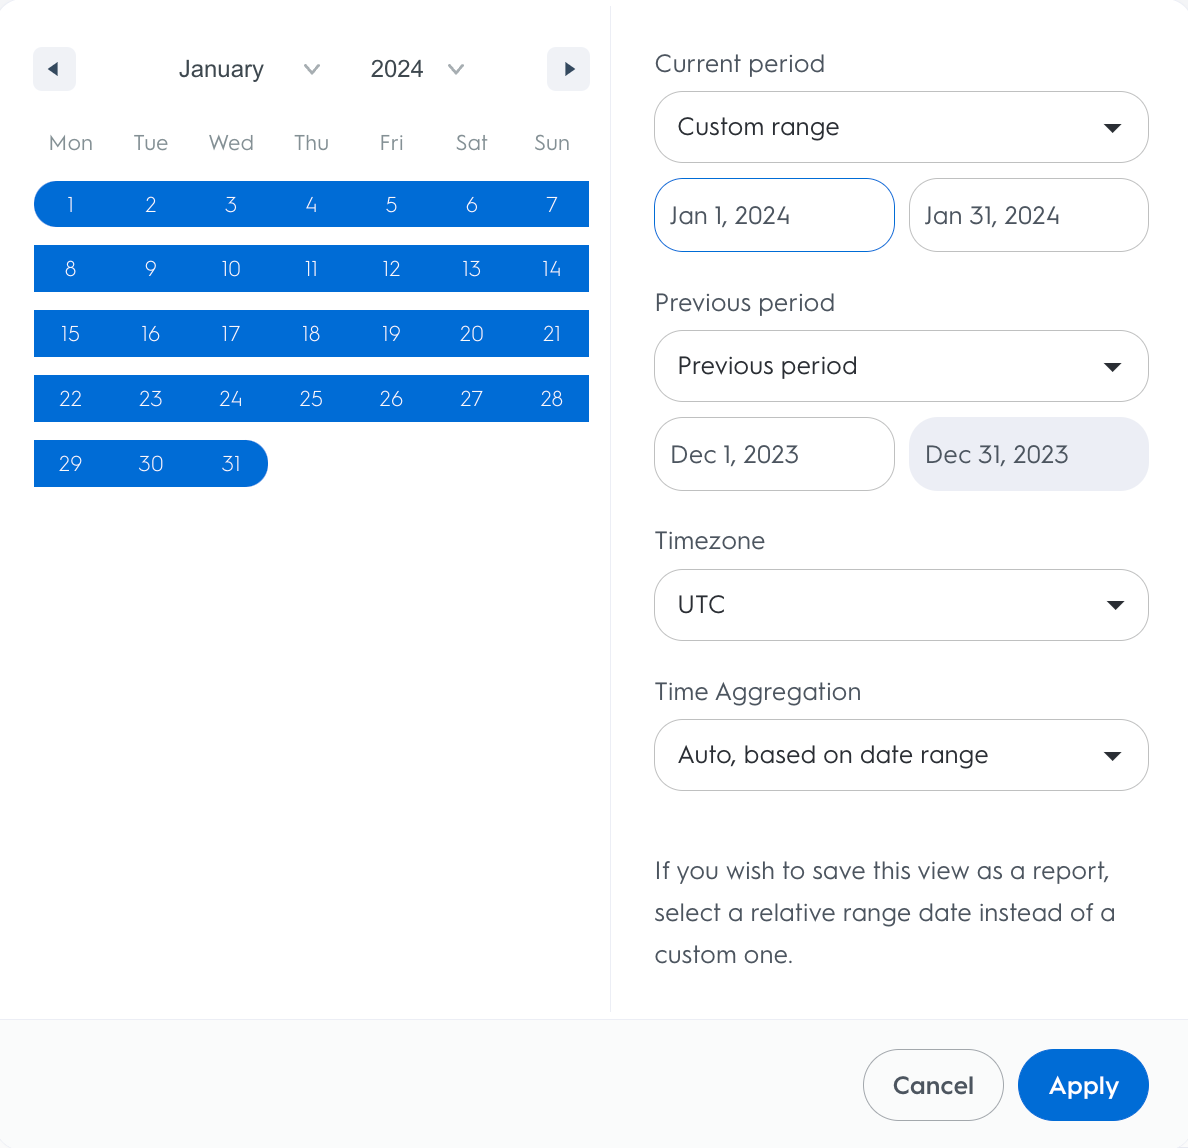
Next, configure time and regional settings by setting up date range, timezone and currency.
Apply Filters and Attribution Models
Set up filters to focus your analysis:
Campaign status filters
Specific campaign selections
Category or brand filters
Performance thresholds
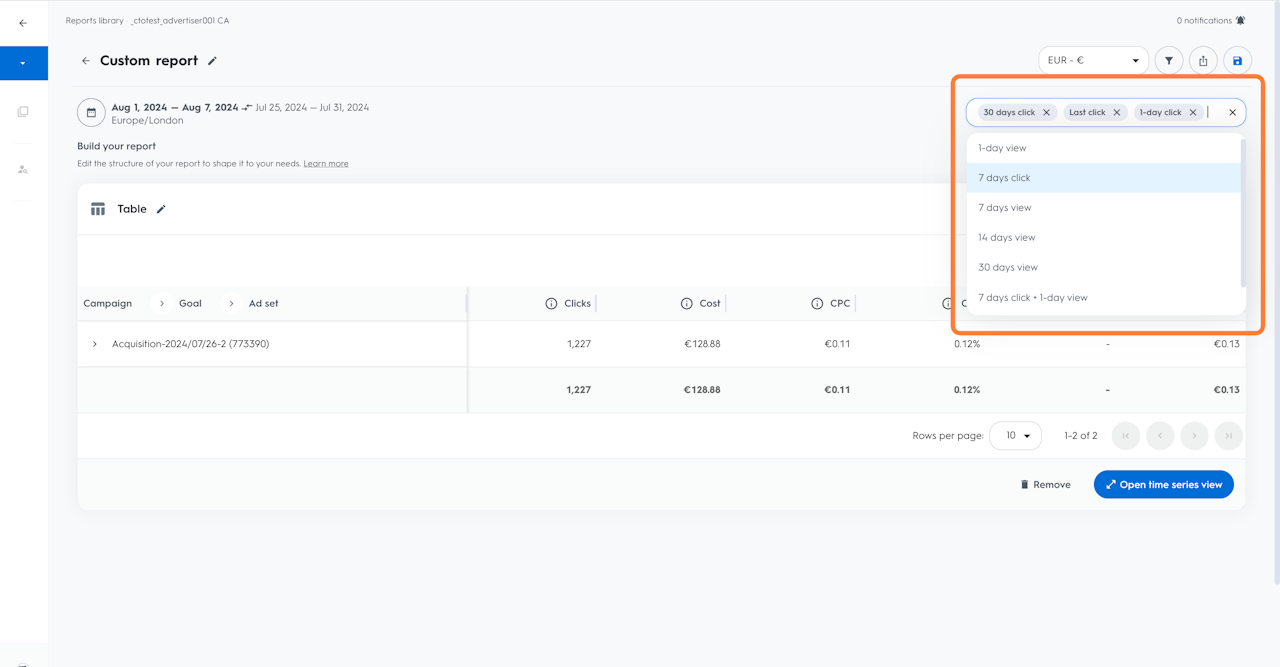
Choose attribution models: Custom reports allow you to select one or multiple attribution models.
The selected attribution models will be displayed with each metric "Sales PC30D", "Sales PV1D", etc.
Add visualizations to your report
After selecting the breakdowns and metrics for your custom report, you have the option to add a visualization.
Select between the two types of graphs:Barchart - For comparing performance across different dimensions.
Time series - For analyzing trends over time.

Saving and scheduling
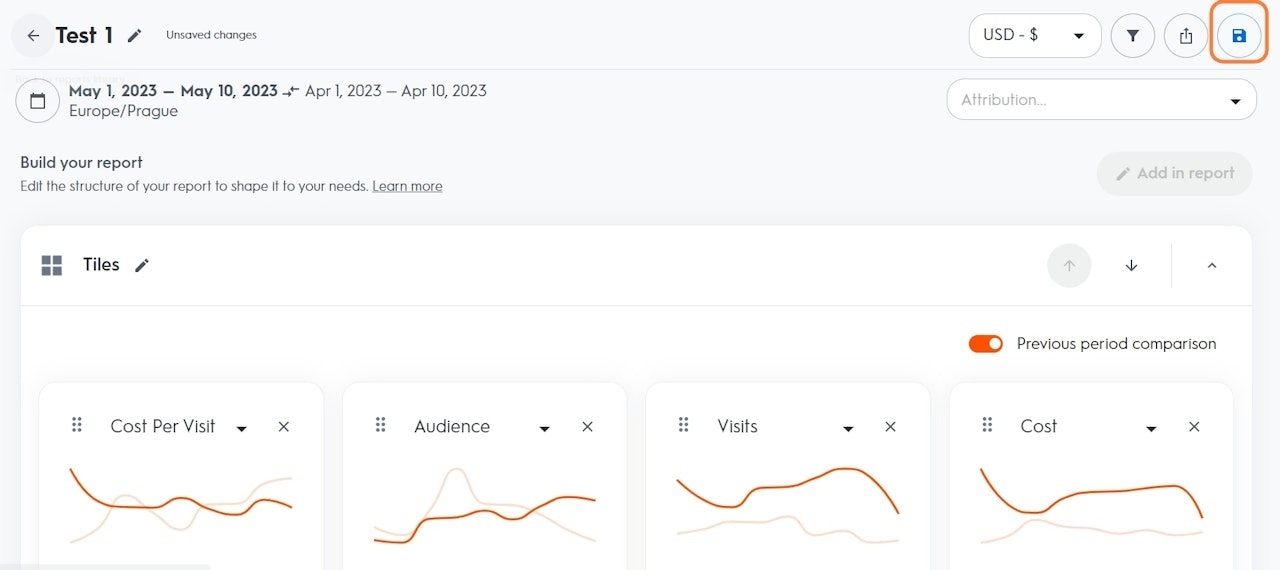
If you would like to access your custom report later, save it by clicking the last icon next to the currency options in the top right corner.
After you have saved a Custom report, you can schedule the report to be sent to your e-mail.

Edit and maintain your report
You can edit any section of your Custom reports at any time by following the steps:
1. From the left navigation panel, select Analytics > Reports library.
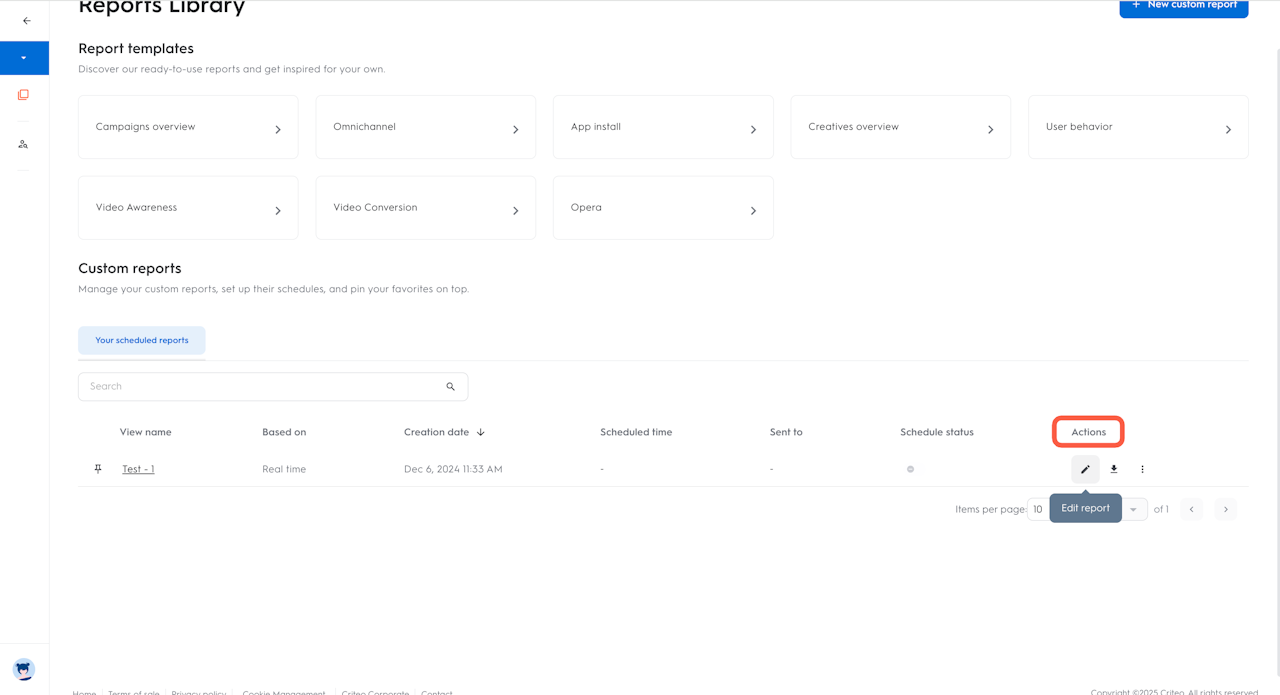
2. Choose the report from your saved reports that you want to edit and click on the pencil icon under actions on the right.
You can change the name, edit, move, or delete blocks according to what insights you wish to display and how. Additionally, adjust metrics, breakdowns, filters, and visualizations as your needs change.

Download and share options
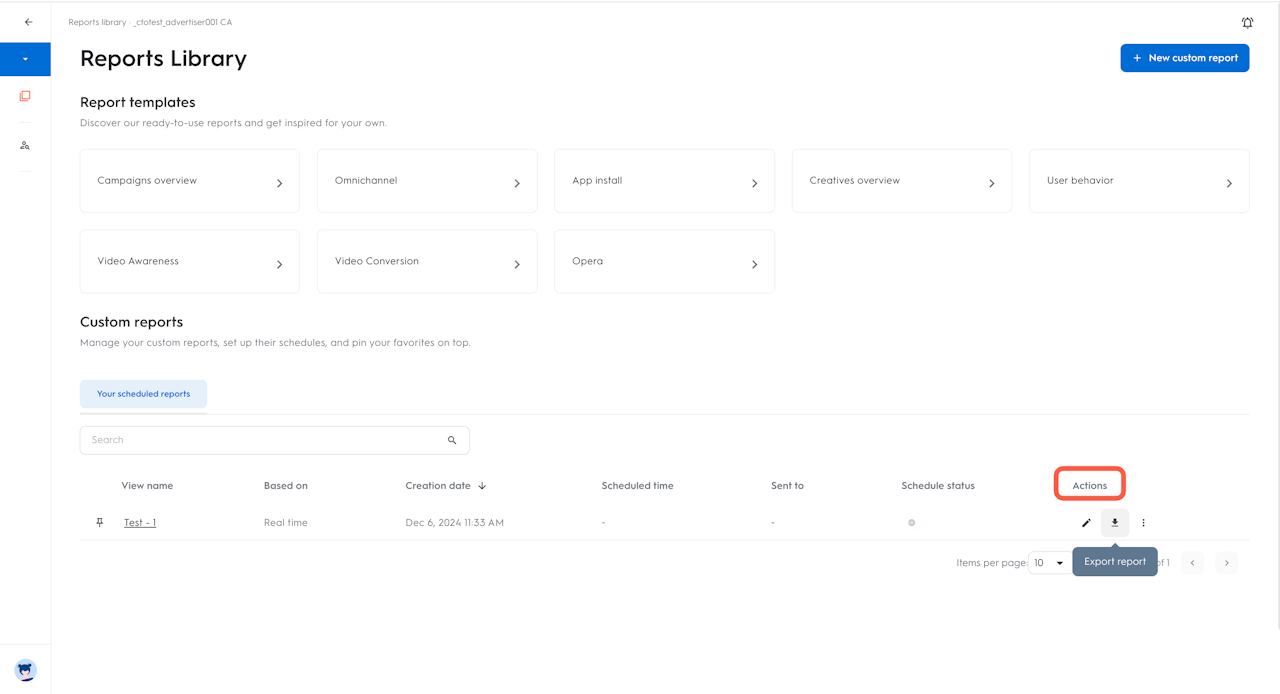
You can download a report by accessing your saved reports using the left navigation bar. Go to Analytics > Reports library. Choose the report from your saved reports that you want to download, and click on the download icon under actions on the right.
You can export your custom report in multiple formats like CSV, Excel or PDF for different use cases.

